This article describes another way to look at the northern hemisphere CRUTem3 data studied by Dr. Roy Spencer in the WUWT article here:
http://wattsupwiththat.com/2012/03/30/spencer-shows-compelling-evidence-of-uhi-in-crutem3-data/
Dr. Spencer identifies a spurious Urban Heat Island (UHI) influence of about 0.13°C per 39 years based on using 3 population density classes out of a possible 5. He shows that this results in a UHI caused overstatement of the temperature trend by about 15% as he describes in the paragraph below:
The CRUTem3 temperature linear trend is about 15% warmer than the lowest population class temperature trend. But if we extrapolate the results in the first plot above to near-zero population density (0.1 persons per sq. km), we get a 30% overestimate of temperature trends from CRUTem3.
In Spencer’s chart below, he shows about 0.13°C over 39 years or about 0.0033°C per year exaggeration in the CRUTemp3 record caused by UHI:
 The chart above shows spurious UHI content of about 0.0033°C per year (chart by Dr. Roy Spencer)
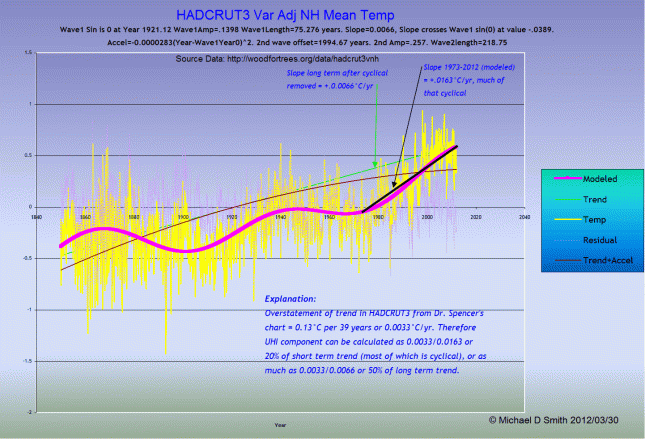
I used a method to remove cyclical signals from the entire dataset. It is a technique I developed to minimize the least squares error by using a dual signal cyclical and exponential model of the temperatures (or anything else). You could argue I have too many degrees of freedom to play with when I curve fit it, and you would be right, but the chart below represents a model with the least error that I could generate. Other combinations work reasonably well too, but have more error than this one.
The section of the NH temperature dataset that Dr. Spencer chose to analyze from 1973 to 2011 is on one of the repeating sawtooth steeper areas of the temperature curve. 1973 was near the bottom of one of the last cooling cycles, right around the time of “the next ice age” scary news stories of the day. This section of the curve also coincides with the steepest part of the sine components that fit well in my analysis. So I would argue that this is much steeper than the long term trend and that Dr. Roy’s analysis therefore underestimates UHI.
As I show in the chart below, the section of the curve that Spencer analyzes is increasing at about 0.0163°C per year, of which 0.0033°C is UHI. On my chart, that is about 20%; he uses 15% as a linear fit. But the long term trend after removing cyclical items is only 0.0066°C per year. So the UHI component is 50% of the long term trend (click to enlarge).
Dr. Spencer goes on to say that if more population classes were used, the amount of UHI increases dramatically, but since there are fewer items in each class, the data is statistically less reliable.
The conclusion I am pointing out here is that even without using more classes, I get a UHI contribution 2.5x higher since my divisor (slope) is lower comparing long term versus short term. Using the paragraph above, if Spencer was able to get from 15% UHI influence to 30% UHI (2x) by extrapolating toward zero population (at 0.1 people per km^2), AND if I can get from 20% to 50% UHI (2.5x) by comparing the short term versus long term, is it possible that UHI in fact accounts for ALL or MORE than 100% of the observed increase in NH CRUTem3 data?
Summary / calculations:
0.0033°C/yr UHI Spencer basis * 2.5 LT.vs.ST * (2x extrapolation to zero population)=0.0165°C/yr.
The long term slope is only 0.0066°C per year, the short term slope is only 0.0163°C/yr.
Has Dr. Spencer found UHI accounting for more than 100% of the total measured increase? It looks possible.
Now start adding classes which adds another very steep multiplier. How important is UHI at much more than 100% of total influence? Probably worth looking into!
Comments welcome.


