RSS

Monthly Archives: January 2012

Image

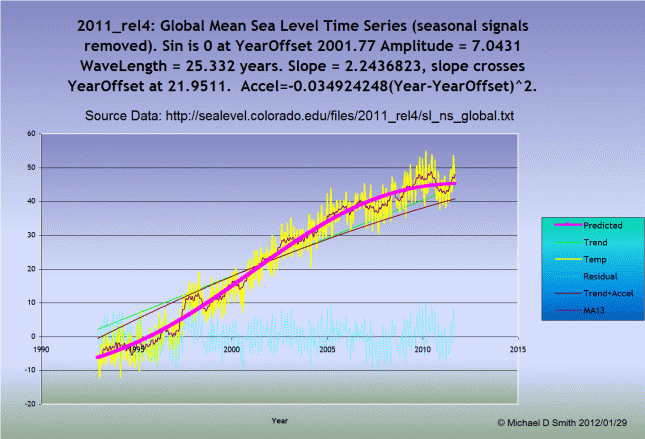
Sea Level Deconstruction

The latest Sea Level data from the University of Colorado

http://sealevel.colorado.edu/files/2011_rel4/sl_ns_global.png

This is a response to Willis Eschenbach’s post at WUWT, http://wattsupwiththat.com/2012/01/29/hansens-sea-shell-game/ .  I thought I would check whether sea level rise is accelerating, or decelerating.  This is pretty easy to test.  I also superimposed the best fit sine wave to capture any longer term cyclical behavior.

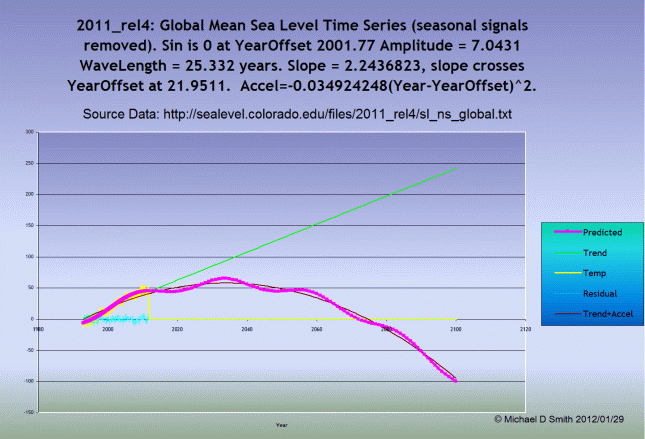
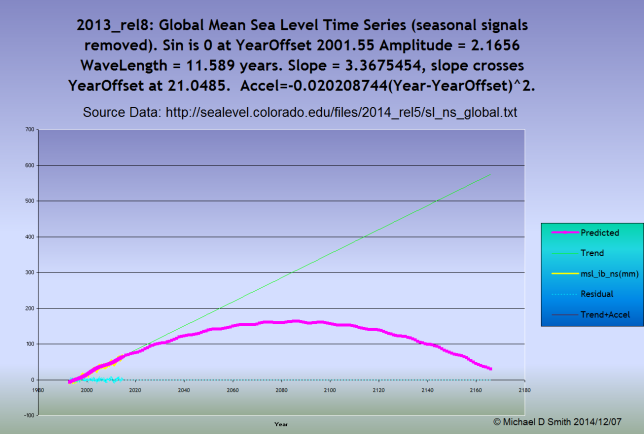
I was unable to model anything that would allow best fit using an accelerating parameter on an exponential function.  Deceleration did improve the least squares error, with or without the sine wave.  The factors are shown in the chart below (click to enlarge):

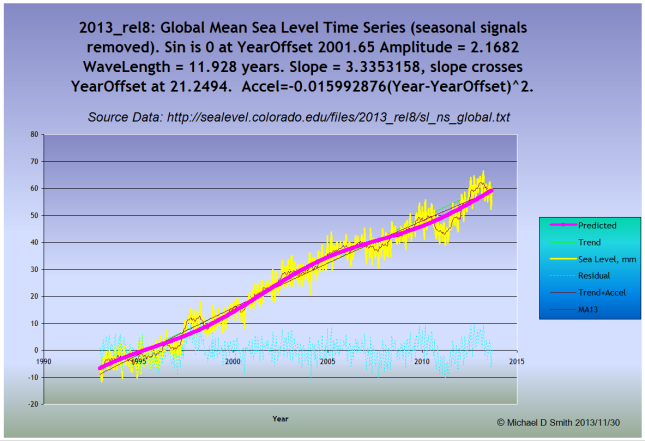
Note that the recent data shows obvious deceleration, as the best fit sine wave and -acceleration factors both show.  Note also that the best fit trend is only 2.24mm/year, well under Hansen’s estimates.  The rest of the total impact is a cyclical element with an amplitude of 7.04mm and a 25.3 year wavelength (of the last cycle at least).  You can see that the residuals are well centered around zero.

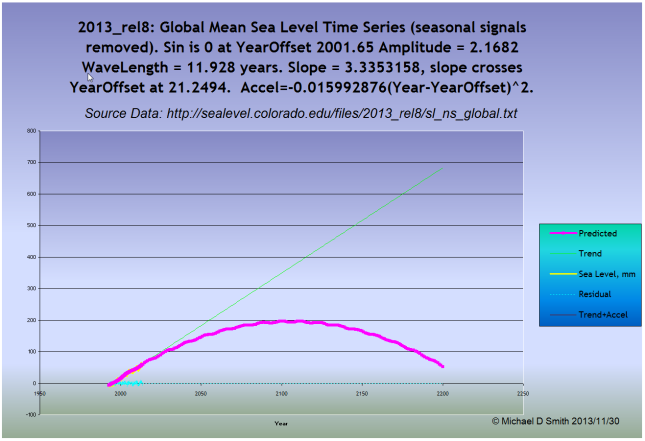
And since Hansen is so willing to make projections of things that are NOT in the data, I’m going to take the liberty of doing all those things Willis tells us not to do in the following chart – project these same factors over the next 88 years to 2100:

So there you have it… Declining sea levels until 2019, then rising again to 2033, and pretty much down hill from there.  Hmmm…  If my projection is based on actual data, does that make mine more credible than those a “real” climate scientist?


Update 2013/11/30:

SineWaveSolver20131130SeaLevel.xls

Acceleration is still negative in 2013 after removing the main cyclical component.  Recovery from the 2011 sea level blip cut the acceleration in half.

SineWaveSolver20131130SeaLevel2.xls

Update 2014/12/07:  Reader @AGrinstead thinks that more recent data will change the outcome:

AslakGrinstad 2014-12-07 23_07_44-Twitter _ Notifications

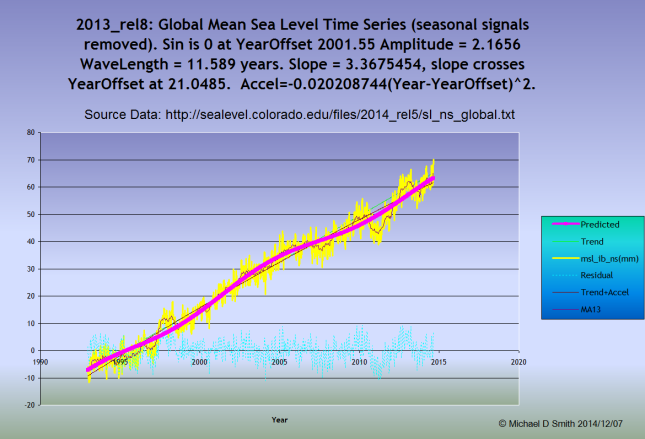
He’s right.  More recent data makes the deceleration even more clear than before.

2014-12-07 22_54_47-Microsoft Excel - SineWaveSolver20141207SeaLevel.xls

This drops the date for zero sea level rise by a few decades:
2014-12-07 22_59_54-Microsoft Excel - SineWaveSolver20141207SeaLevel Chart 2.xls


1 Comment

Posted by on January 30, 2012 in Climate


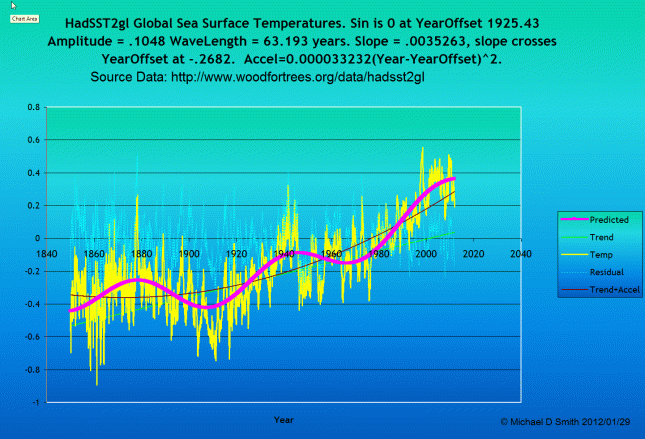
HadSST2gl Sea Surface Temperature Deconstruction

 
Leave a comment

Posted by on January 29, 2012 in Climate


HadCRUT3vgl Global Temp Deconstruction

HadCrut3vgl… New, more precise goal seeker written by me now in use.

 
Leave a comment

Posted by on January 29, 2012 in Climate


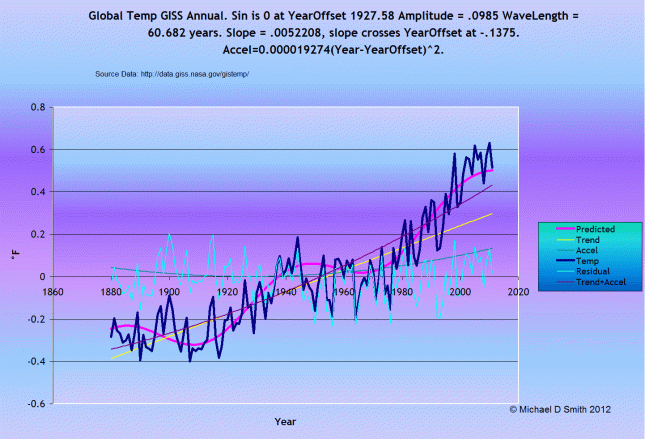
Global Temperature Deconstruction

(click to enlarge)

Global Temperature factors for sine wave, trend, acceleration using GISTemp (highly suspect starting data)

 
Leave a comment

Posted by on January 28, 2012 in Climate


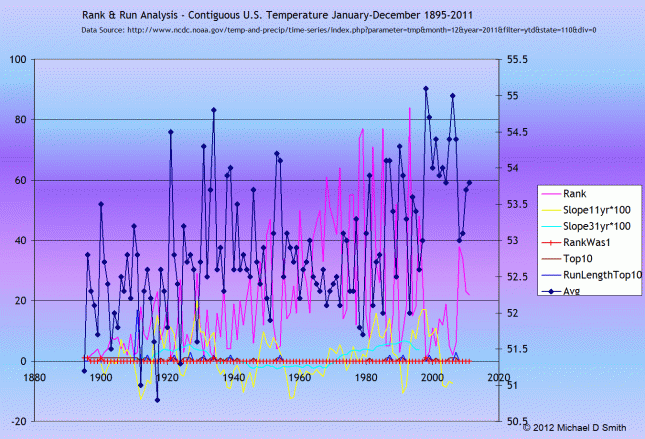
USA Run and Rank Analysis

(click to enlarge)

USA temps show nothing unusual in terms of rank… Slope is now negative, only a few values even in the top 10 lately, which should be a common event in rising temperatures.  Only 6 times in the record were temperatures ranked number one.  One of those was in 1998, the last previous was in 1934. The frequency of top 10 events is not unusual at all, and the length of any runs of top 10 temperatures is low compared to global temp runs in the top 10 (currently at 18 years).

 
Leave a comment

Posted by on January 28, 2012 in Climate


USA Temperature Deconstruction

Temp deconstruction of USA mean temps.

 
Leave a comment

Posted by on January 28, 2012 in Climate


GISTemp Annual Rank & Run Analysis

Using GISTEMP, annual average only, 62.9% of ALL years are in the top 10.  There is nothing unusual at all about having most of the last years in the top 10. We are in a pretty good run, with 18 of the last years in the top 10. The next longest streak was 12 years from 1934 to 1945. 14.4% of ALL years (of 132) were ranked as #1.  When in an overall uptrend, it would (obviously) not be uncommon for most of the most recent data to be near the top.  I notice the same thing when I drive.  I’m almost always closer to the destination the longer I drive 🙂  The likelihood depends on the slope and the underlying variation.

 
2 Comments

Posted by on January 27, 2012 in Climate


Dye 3 Temperature – Is it Normal?

Here is the Dye 3 temperature data used in the posts http://wattsupwiththat.com/2012/01/21/ap-index-neutrons-and-climate/ and http://wattsupwiththat.com/2012/01/24/the-message-in-the-dye-3-data/.  It has been detrended and normalized.  The bins are 0.01 sigma wide.  Actual frequency should be compared with normal density.  The accumulated actual and accumulated normal lie almost on top of each other.  The last series is the difference between (actual accumulated and standard normal accumulated)*10.  The tiny differences you see in the accum charts are multiplied by 10 so you can see which accum is above the other.  This is as normal as you are going to find.  I didn’t bother with any tests for normality because the result is obvious.

 
2 Comments

Posted by on January 24, 2012 in Climate


Fairbanks Temp deconstruction

Fairbanks 13month MA of mean temp.  Once the cycle is accounted for, trend is down, but time^2 factor shows upward.  Essentially flat.

 
Leave a comment

Posted by on January 8, 2012 in Climate


Texas Annual Temperature with Cyclical Components

 
5 Comments

Posted by on January 7, 2012 in Climate