
The latest Sea Level data from the University of Colorado
http://sealevel.colorado.edu/files/2011_rel4/sl_ns_global.png
This is a response to Willis Eschenbach’s post at WUWT, http://wattsupwiththat.com/2012/01/29/hansens-sea-shell-game/ . I thought I would check whether sea level rise is accelerating, or decelerating. This is pretty easy to test. I also superimposed the best fit sine wave to capture any longer term cyclical behavior.
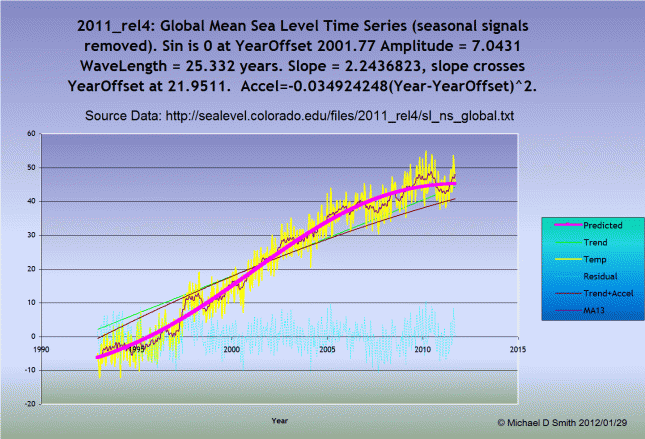
I was unable to model anything that would allow best fit using an accelerating parameter on an exponential function. Deceleration did improve the least squares error, with or without the sine wave. The factors are shown in the chart below (click to enlarge):
Note that the recent data shows obvious deceleration, as the best fit sine wave and -acceleration factors both show. Note also that the best fit trend is only 2.24mm/year, well under Hansen’s estimates. The rest of the total impact is a cyclical element with an amplitude of 7.04mm and a 25.3 year wavelength (of the last cycle at least). You can see that the residuals are well centered around zero.
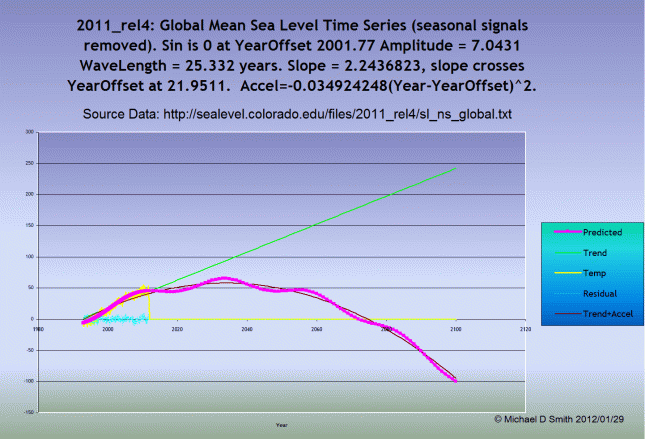
And since Hansen is so willing to make projections of things that are NOT in the data, I’m going to take the liberty of doing all those things Willis tells us not to do in the following chart – project these same factors over the next 88 years to 2100:
So there you have it… Declining sea levels until 2019, then rising again to 2033, and pretty much down hill from there. Hmmm… If my projection is based on actual data, does that make mine more credible than those a “real” climate scientist?
Update 2013/11/30:
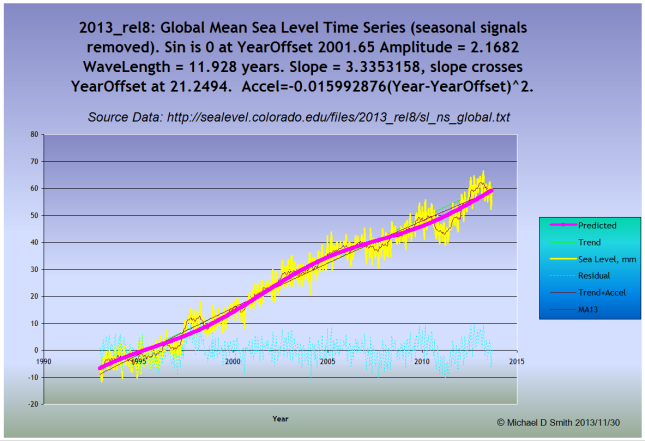
Acceleration is still negative in 2013 after removing the main cyclical component. Recovery from the 2011 sea level blip cut the acceleration in half.
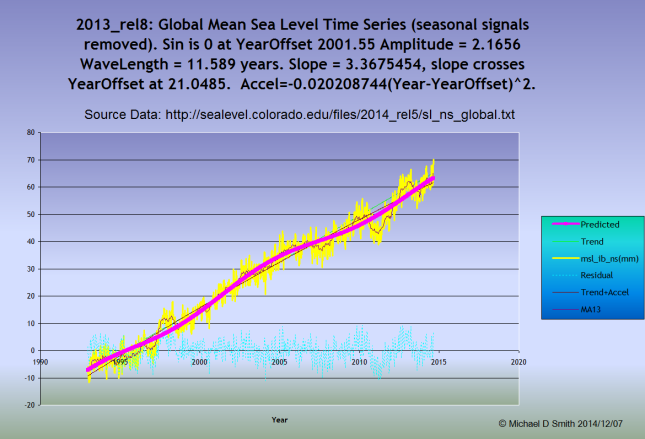
Update 2014/12/07: Reader @AGrinstead thinks that more recent data will change the outcome:
He’s right. More recent data makes the deceleration even more clear than before.
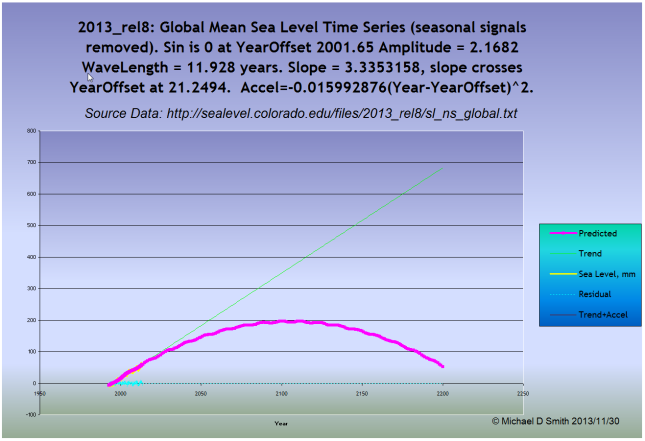
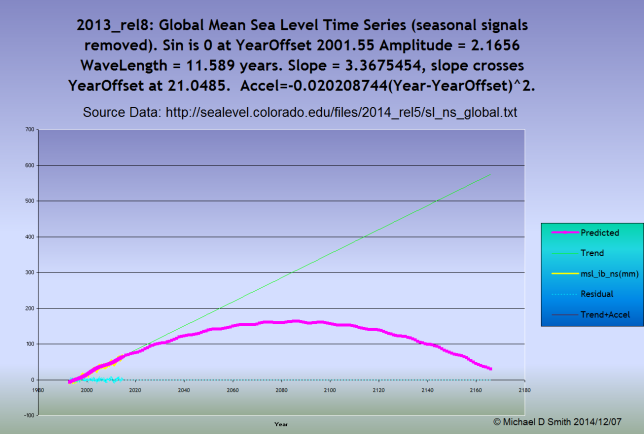
This drops the date for zero sea level rise by a few decades:

Aslak Grinsted
December 8, 2014 at 3:40 am
In the beginning of your post you fit a statistical model to the data until 2011. This model suggest that there will be a deceleration in sea level rise the next few years. You also show a simpler and more parsimonious model which is a plain linear trend.
Now a few years has passed and we can verify which of these two models fits best. Clearly the plain linear trend fits the 2011-2014 data much better. This is what i was trying to make you realize on twitter. Data here: http://sealevel.colorado.edu
Unfortunately instead of making this simple test then you decide to fit a new model. Please note your new model is completely inconsistent with your old model. Your first model had wavelength=25yrs, and your new model has wavelength=11yrs. Can you see why i find it hard to believe in either cycle when the results are not more robust to which data period you use, and when more parsimonious models fit the data better in an out of sample validation?